Small value equities are valued -38% below their 10-year average, while growth, defensive, low volatility, and ESG factors exceed the bubble threshold of +30%. This dispersion has reached a 20-year high, in line with the dot-com bubble. However, bubbles can last a long time with infrequent reversion catalysts.
We believe as the economy starts to reopen from the COVID-19 pandemic, we will likely start to experience yield curve steepening as the Fed has vowed to keep shorter-term interest rates at zero as longer-term rates start to rise as the recovery starts to take shape. The pandemic has favored growth stocks, such as biotech's developing the COVID-19 vaccine and software companies that benefit from recent telecommuting trends, which has widened the spread of growth to value to near historic highs.
Current P/E vs Last 10 Year Average by Equity Factor
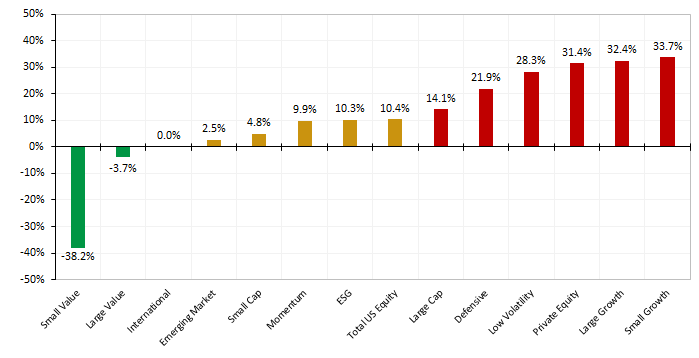
As of 4/30/2020. Source: Bloomberg. Indices: Russell 2000 Value, Russell 2000, Russell 2000 Growth, MSCI ACWI ex USA, Russell 1000 Value, MSCI EM, Russell 3000, Russell 1000, MSCI Momentum, MSCI ESG Leaders, Russell 1000 Defensive, MSCI Low Volatility, Russell 1000 Growth. Private Equity: S&P Global Market Intelligence LBO Multiples.
3 key trends that helped inflate this bubble are summarized below. Value stocks are typically on the other side of these trends, and stand to benefit the most should the trends reverse, or at least normalize to lesser extremes.
-
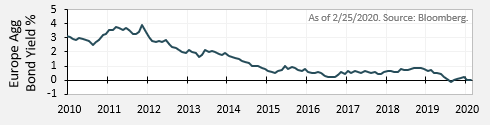
Central banks pushing global yields negative
This heavily propped up secular growth/tech and defensive sectors
-
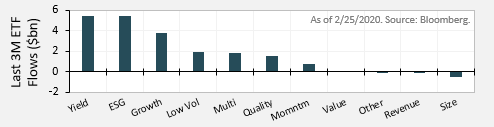
Growth of passive, smart beta strategies
Flows funneled into smart beta strategies with high holdings overlap, amplifying momentum effect on mega cap, low vol, growth/tech
-
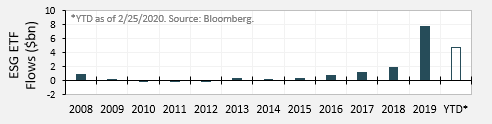
Growth of simplistic ESG schemes
Continuation of crowding trends, funneled into low vol/mega cap/tech/etc.
The coronavirus epidemic initially shut down markets across the globe. As economies start to slowly reopen and adapt to a “new normal”, we believe this trend favors value stocks going forward. Revenues of most value stocks have been impacted by the pandemic shutdown, and thus have traded down to significantly lower valuations. After this unprecedented shutdown, we believe value stocks will have extremely low bases for which to show significant improvement going forward and thus driving return potential. In our view, it is important to study balance sheets as companies have raised higher levels of debt to survive the temporary shutdown. If cash flow improvement is not significant, it may lead to prolonged business loss. However, during this pandemic, highly speculative biotech companies scrambling for the first COVID-19 vaccine have skyrocketed and software companies benefitting from telecommuting trends have dominated the performance landscape.
In conclusion we believe small cap value stocks are primed to recover as valuation multiples have reverted to long term 2010-2020 levels. The pandemic has confirmed many themes that have worked over the last 10 years to push the market to extremes not seen since 2000. Investors should not lose sight of what we believe determines true value for a company; the tenants of cash flow. A bubble collapse may also be imminent as interest rate, momentum, and smart beta trends have inflated low volatility, growth, technology, and defensive factors to unsustainable levels.
A PDF Version can be found here.
The subject matter contained herein has been derived from several sources believed to be reliable and accurate at the time of compilation, but no representation or warranty (express or implied) is made as to the accuracy or completeness of any of this information. Under no circumstances should this information be construed as a recommendation or advice. The views expressed herein reflect the professional opinions of the portfolio managers and are subject to change. Penn Capital does not accept any liability for losses either direct or consequential caused by the use of, or reliance upon, this information. These views are subject to change at any time and they do not guarantee future performance of the markets. Investing in the stock market involves gains and losses and may not be suitable for all investors. Investors have the opportunity for losses as well as profits.
Please remember that past performance may not be indicative of future results. Different types of investments involve varying degrees of risk, and there can be no assurance that the future performance of any specific investment, investment strategy, or product (including the investments and/or investment strategies recommended or undertaken by Penn Capital), or any non-investment related content, made reference to directly or indirectly contained within this commentary be suitable for your portfolio or individual situation, or prove successful. Comparisons to indices are inherently unreliable indicators of future performance. The strategies used to generate the performance vary from those used to generate the returns depicted in the benchmarks. Penn Capital makes no representation as to the methodology used to generate the benchmark returns. Portfolio holdings are subject change and may or may not be held by one or more Penn Capital portfolios from time to time. Transactions in such securities may be made which seemingly contradict the references to them for a variety of reasons, including but not limited to, liquidity to meet redemptions or overall portfolio rebalancing.
Indices are unmanaged and not available for direct investment. Index comparisons have limitations because indexes have volatility and other material characteristics that may differ from a particular investment. Index performance does not reflect deductions for fees, expenses or taxes. Benchmark returns are not covered by the report of independent verifiers. Note that comparing the performance to a different index might have materially different results than those shown. The Russell 2000 Value Index is comprised of the 2,000 smallest companies in the value sector of the Russell 3000 Index. The Russell 1000 Growth Index is comprised of the 1,000 largest companies in the growth sector of the Russell 3000 Index. The Russell 2000 Index is comprised of the 2,000 smallest companies in the Russell 3000 Index, representing approximately 11% of the Russell 3000 total market capitalization. The Russell 2000 Growth Index measures the performance of those Russell 2000 companies with higher price-to-book ratios and higher forecasted growth values. The MSCI ACWI Ex-US Index is a market-capitalization-weighted index and is designed to provide a broad measure of stock performance throughout the world, with the exception of US-based companies and includes both developed and emerging markets. The Russell 1000 Value Index measures the performance of the large-cap growth segment of the US equity universe. It includes those Russell 1000 companies with higher price-to-book ratios and higher forecasted growth values. The MSCI Emerging Markets Index captures large and mid cap representation across 26 Emerging Markets countries and covers approximately 85% of the free float-adjusted market capitalization in each country. The MSCI ESG Leaders Index uses a best-in-class approach by only selecting companies that have the highest MSCI ESG Ratings. They are free float-adjusted market capitalization weighted indexes designed to represent the performance of companies that have favorable ESG profiles compared to industry peers. Overall the indexes target a 50% sector representation vs. the parent index. The MSCI Momentum Index aims to reflect the performance of an equity momentum strategy by identifying stocks with high price performance in recent history, up to 12-months. The MSCI USA Minimum Volatility Index aims to reflect the performance characteristics of a minimum variance strategy applied to the large and mid cap USA equity universe. The Russell 1000 Defensive Index measures the performance of the large-cap defensive segment of the US equity universe. It includes those Russell 1000 Index companies that are more stable and are less sensitive to economic cycles, credit cycles, and market volatility based on their stability variables. The Russell 3000 Index is a market-capitalization-weighted equity index maintained by the FTSE Russell that provides exposure to the entire U.S. stock market. The index tracks the performance of the 3,000 largest U.S.-traded stocks which represent about 98% of all U.S incorporated equity securities The Russell 1000 Index measures the performance of the large-cap growth segment of the US equity universe.